What does a pump curve show?
Being able to read a pump curve is essential when selecting an industrial pump. The pump curve will tell you whether it is able to efficiently perform the required flow rate at a certain pressure, and therefore whether it is suitable for your application. This is the most widely used function of the pump curve, although it can also be used to determine the required power to operate it. Selecting a pump that operates too far to one side of the curve can cause pump damage, poor performance and unnecessary energy consumption. We have therefore put together a guide for our customers on how to read a pump curve.
Before reading a pump curve the following six items should be known to ensure that the pump you select will be correct:
- Application
- Liquid being pumped
- Viscosity and temperature
- Flow rate required
- Pressure required
- Voltage and frequency
Usually a pump curve will have flow rate on the horizontal axis (usually in l/min or m³/h) and the pressure on the vertical axis (usually bar or height in metres). The curve represents the flow rate the pump will produce at certain levels of pressure when the pump is operating properly, or oppositely, the pressure the pump will work at when it is providing a certain flow rate.
Unless specified, all centrifugal pump curves are based on water which is important to remember when dealing with fluids of differing viscosities and specific gravities. If they are not based on water, the fluid the pump curve is based on will usually be detailed at the top, and it is important that a comparison is drawn between the curve supplied and the intended application. If a pump is being used on oil all year round outside and the curve is based on oil at 20°C, then a curve should be requested for the oil at ambient temperature in winter and a check made that the pump is still suitable.
How to read a centrifugal pump curve?
A centrifugal pump curve has its highest point on the left and gradually slopes down to the right. As you can see in the curve to the right it will produce differing amounts of flow and pressure until the curve ends. Looking at the adjacent pump curve at first appearance the points of intersection show that the pump is capable of producing zero flow at 41m and a maximum flow of 2100L/min at 23m. So how is it possible that a pump can produce no flow at some points yet also produce 2300L/min with the absence of any controls? How do we control the flow and pressure? The flow and pressure produced by a pump is controlled by the system it is installed in. A pump cannot be considered as a standalone item; only as part of a complete system.
In the top right hand corner of the curve it tells use the speed of the motor and frequency that the pump will be operated at. It is important that this information is checked, as the frequency affects the speed at which a motor will run (see below table) and differing countries use different frequencies .For example, in the UK 50Hz is used yet in the USA 60Hz is used. A motor can also have differing numbers of poles to reduce its speed, similar to how a gearbox works to reduce ratios.
As the pump impeller speed is the same as the motor speed, the speed of the motor has a direct effect on the flow rate and pressure produced by the pump. A pump being run at 60Hz as opposed to 50Hz produces 20% more flow and pressure, which can lead to a different pump being selected for the same application.
| Motor Shaft Speed 50Hz | Motor Shaft Speed 60Hz | Poles in Motor |
| 3000rpm | 3600rpm | 2 |
| 1500rpm | 1800rpm | 4 |
| 1000rpm | 1200rpm | 6 |
| 750rpm | 900rpm | 8 |
| 600rpm | 720rpm | 10 |
You will notice in the above curve that the pump is being operated at 2940rpm (3000rpm) so this curve is for a pump operating at 50Hz. Castle Pumps performance curves are based on the actual motor rpms that are used, whereas some manufacturers round up the rpms to the nearest thousand making the curve less accurate.
You will also notice at the bottom of the curve that it mentions the tolerance that the curves are drawn to: ISO9906. With every pump curve there is a tolerance depending on the size of the motor. The tolerance can be between 10% (class 3), between 5-7% (Class 2) or 3% (class 1). The larger the motor and capacity of the pump then the lower the tolerance.
Total Dynamic Head
In order to understand where on a curve the pump will operate we need to understand the Total Dynamic Head (TDH); the total pressure a pump requires to operate. To determine the total dynamic head we need to understand the friction losses, and differences in heights of the pumping application.
The Total Dynamic Head (TDH) comprises of:
Static Head: The difference in height between the pump and point of discharge, which is usually a fixed distance and should be calculated as the maximum distance.
Suction Lift: The difference in height between the fluid and inlet of the pump. This should be calculated as the worst case i.e. lowest level of liquid in the tank
Friction loss – This is the total losses sustained by the liquid as it flows from the suction pipe to the point of discharge. Losses are incurred as the liquid flows through bends, valves, pipework which cause the liquid to dissipate energy losing momentum. Anything introduced within a fluids path will cause a pressure loss. The more viscous a liquid, the larger amount of energy dissipation and the more energy required to keep the fluid moving.
TDH Example 1 - Pump operating in suction lift (blue line on curve below)
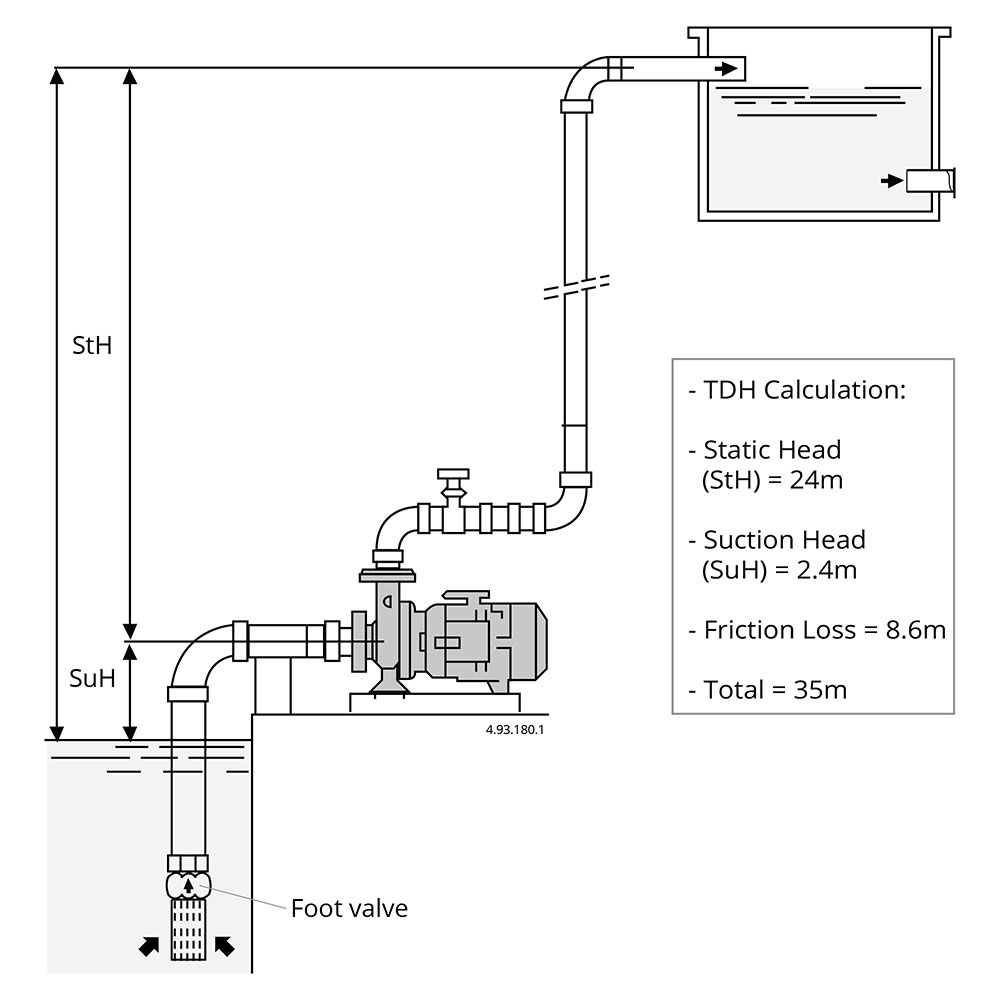
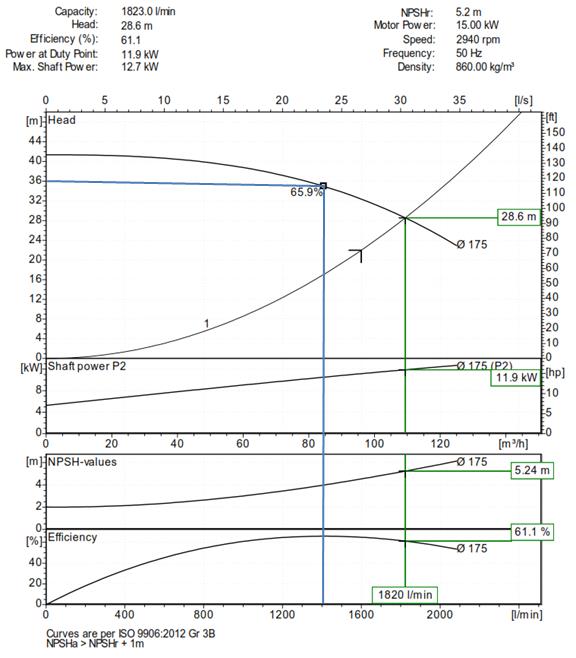
If the TDH was 35m then we would draw a line on the pump curve from where the head is 35m, and the point this intersects with the curve (duty point) is the flow rate produced by the pump; 1400L/min. See blue line on below curve.
TDH Example 2 - Pump operating under positive suction head (green line on curve below)
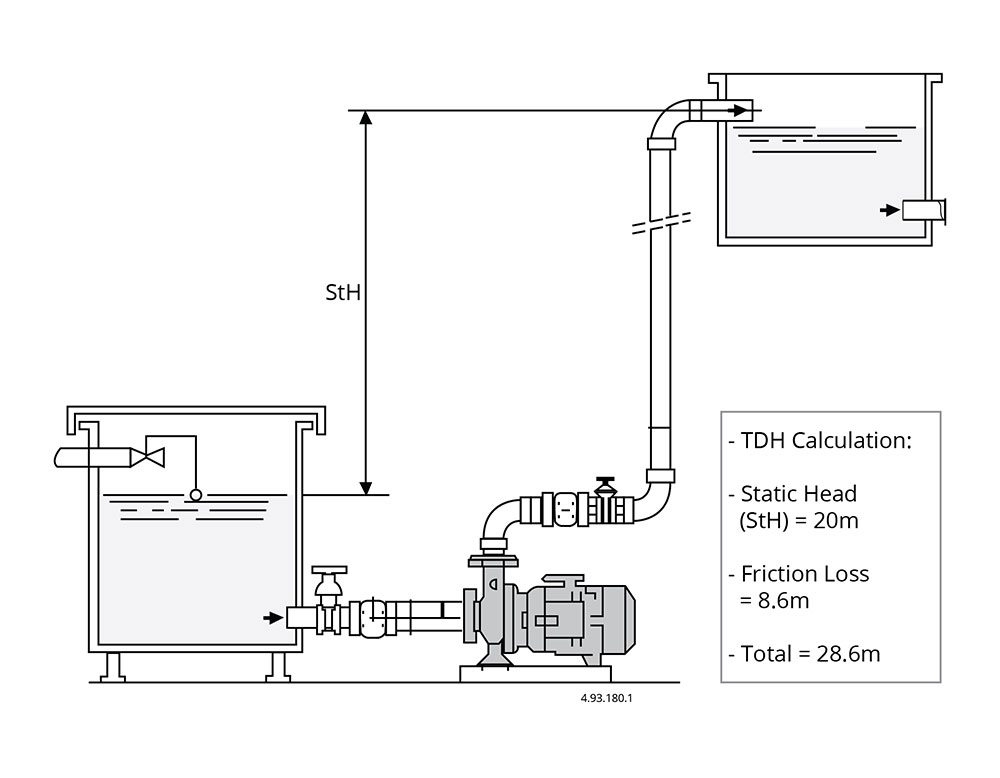
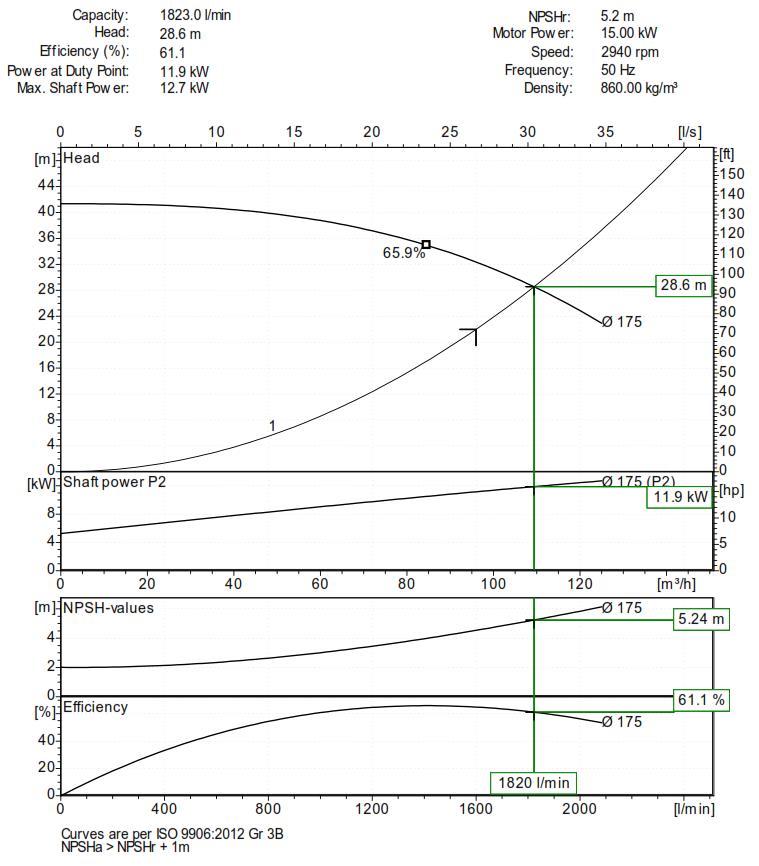
If the TDH was 28.6m, pump model SNM50-160 will offer a flow rate of 1820L/min at 28.6m head as this is the point of intersection (duty point). See green line on below curve.
Best Efficiency Point Curve
Although a pump curve shows the various flow rates and pressures a pump can operate at, this does not mean the pump should be operated at all points on a pump curve. As a simple comparison a car has many gears, and although first gear may take you from zero to 40mph, it would not be good for the engine to be driven at 40mph in first gear. Neither is it good for the engine if the car is driven at 10mph in third gear even though it is possible for the engine to operate at these speeds.It is ideal for the pump to operate within two thirds of its curve, and at the duty point (the point at which the flow rate and pressure intersect) there should be at least a 10% rise to the left of the curve above the duty point.
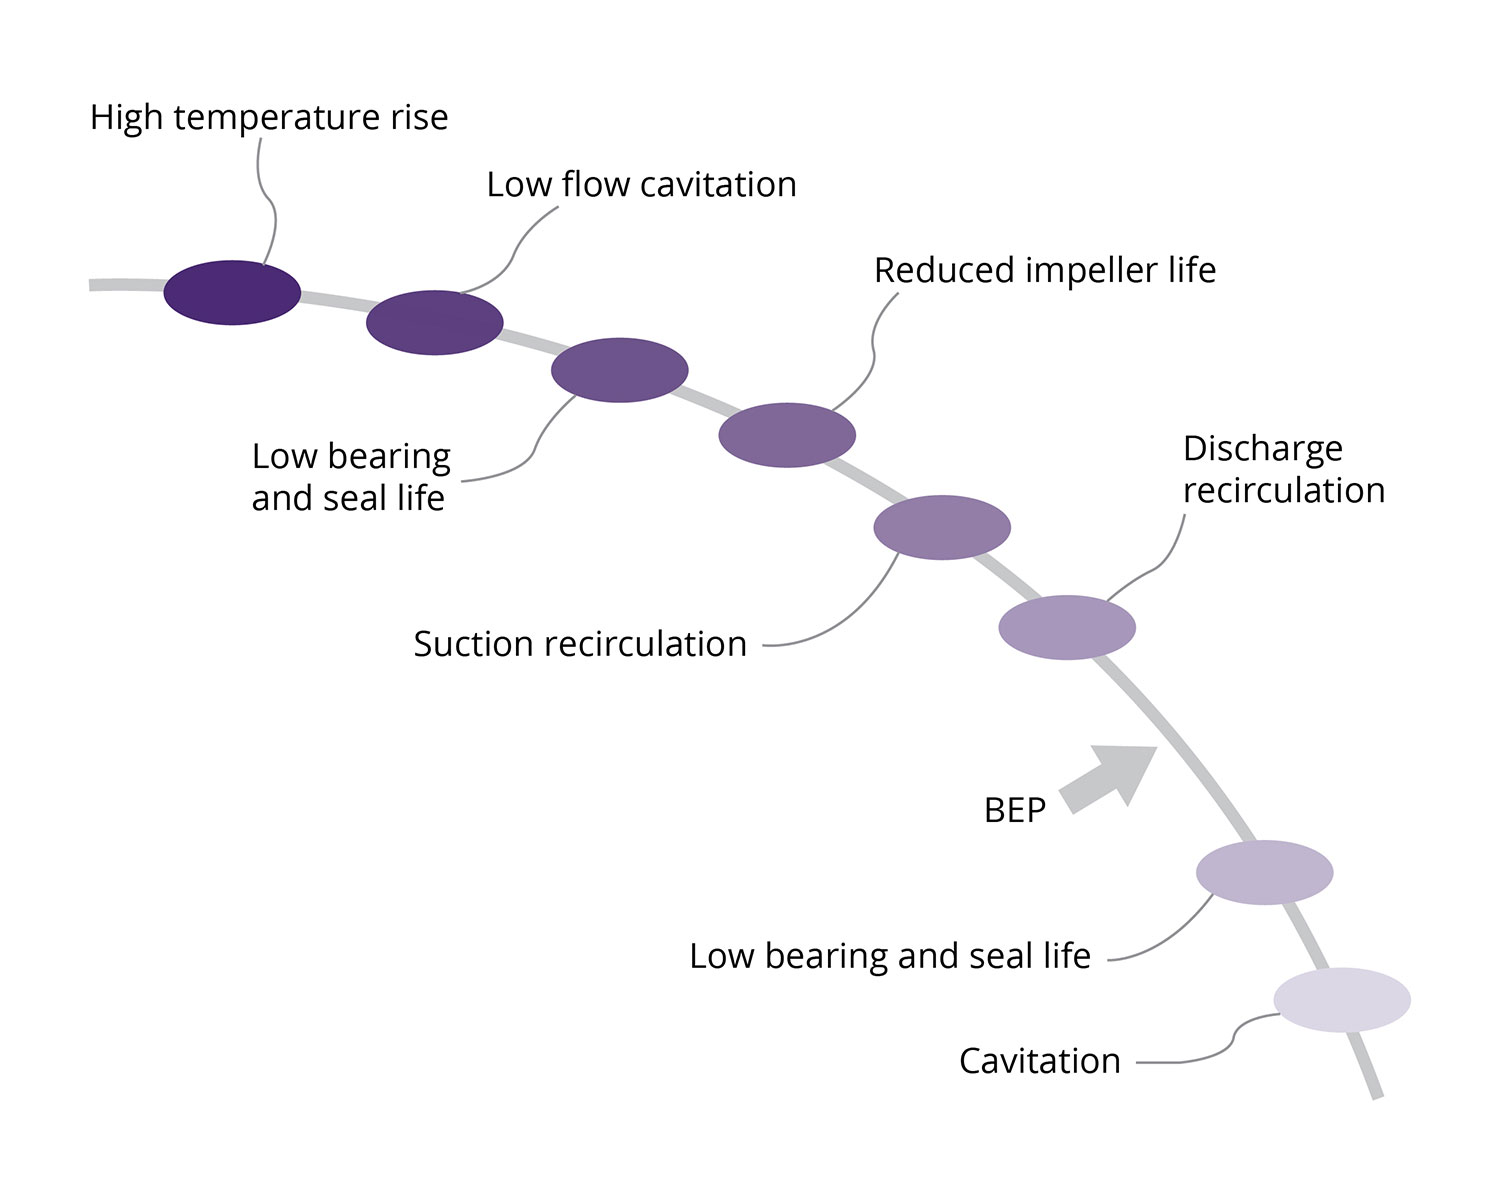
To the right is an exaggerated drawing of a pump curve indicating the various problems that can occur if the pump is ran too far to the left or right of the best efficiency point (BEP). The minimum safe continuous flow of a pump is typically 40% of its best efficiency point, and is defined as the minimum flow a pump should produce in order to operate without any issues such as high temperature rise, low flow cavitation or low bearing and seal life.
All centrifugal pumps have a point in the curve whereby they operate at their highest efficiency. Efficiency is usually a half moon curve with the percentage efficiency on the vertical axis. A pump will usually be at its highest efficiency around the middle of its flow/pressure curve, and there will usually be a number on the pump efficiency curve indicating the percentage efficiency at its duty point. A centrifugal pump will be less efficient if a more viscous fluid is pumped. A pump is designed to be the most efficient when the impeller is at its full size, and so if the impeller is trimmed the overall efficiency of the pump will be reduced. The size of the pump impeller is usually indicated at the end of the performance curve and efficiency curve with the diameter symbol ø followed by the measurements in mm. On the below graph this is 175mm.
As in the below curve, some pump curves show the kW and NPSH required for the pump to operate at the specified duty point. For example, at the above flow rate of 1820 L/min at 28.6m head, if you draw a line from the point of intersection to the kW line and then across to the left axis it shows that the power consumed at the duty point will be 11.9kW. But in the top right hand corner it states that we have selected a pump which has a 15kW motor. The motor is oversized to take into account the end of the curve as well as any other external factors which may lead to higher power being required, such as operating in conditions where it may be less efficient e.g. in high temperatures.
NPSH
More complicated pump curves will bring in other factors such as Net Positive Suction Head (NPSH). The NPSH Required (NPSHR) is the minimum amount of inlet pressure required by the pump in order for it to work at the duty point requested. NPSHA is the amount of Net Positive Suction Head available in the system. The NPSHA must be equal or higher to the NPSHR in order for the pump to operate at the corresponding duty point. On our NPSH curves the values are exact and so a safety factor of at least 1m should be added.
On the above curve in order to obtain a flow rate of 1820L/min a minimum of 5.24m of inlet pressure is required. If the pump has insufficient NPSH then the pump will not work at the required performance and the pump will cavitate leading to damage and wear. Typically at sea level we have 10M of NPSH available due to air pressure exerting on a fluid when in an open tank plus the height of the fluid level. NPSH becomes an issue when there are either long suction pipe runs leading to the pump, smaller diameter pipes connected to the pump than the inlet size, presence of air, low tank levels, high flow rates and viscous fluids.
The amount of NPSH required can be reduced by:
- Operating the pump closer to its best efficiency point
- Reducing the speed of the pump
- Adding more suction pressure by raising fluid level in any suction tanks or pipework
- Reducing the temperature of the fluid
Cavitation
Cavitation is the process that occurs when a pumped liquid drops below its vapour pressure. This causes the liquid to vaporise forming small bubbles as it passes through a pump, which then collapse creating destructive microjects strong enough to damage the pump in any material. Cavitation can create holes in the pump casing causing the water to leak from the pump and a drop in the pumps efficiency. Cavitation can be reduced by:
- Operating the pump closer to its best efficiency point
- Reducing the speed of the pump. A slower motor means less NPSH is required.
- Add more suction pressure by raising fluid level in any suction tanks or pipework
- Reduce the temperature of the fluid
- Unclogging filters
- Checking discharge pressure
- Ensure air is not present in the liquid, or in suction pipework
Cavitation sounds like the pump is pumping gravel and is much noisier than it should be. Suction and discharge gauges should be mounted on pipework to enable site engineers to check the pump is operating at the correct point on the curve.
Impeller Diameters
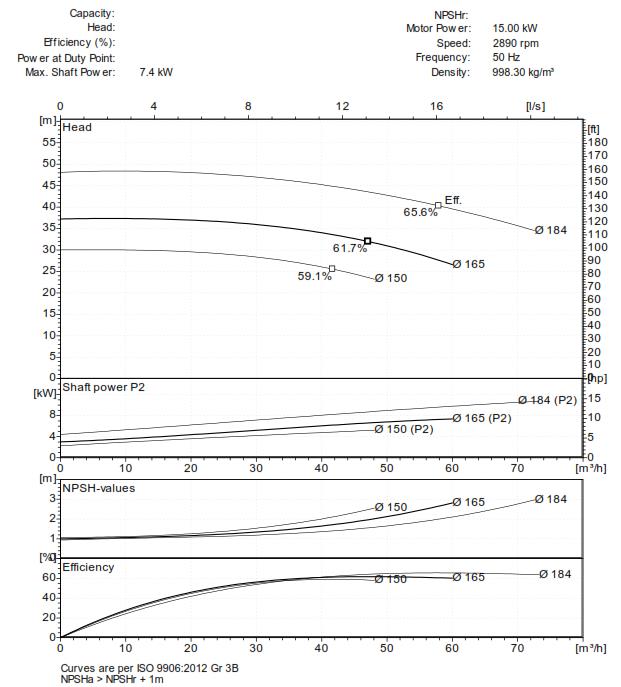
The graph to the right shows multiple curves that represent different impeller sizes and the impact that these have on the flow and head of the pump model in question. As the impeller diameter is reduced, the pump curve decreases meaning less pressure and flow is produced by the pump. Castle Pumps work with customers to ensure our pump selection is based upon your performance requirements and trim your impellers to suit.
Being able to read a curve in this way will help you to select a pump model that meets your application’s performance requirements. If in doubt, contact one of our technical sales engineers on +44 (0) 1773 533 283.
A pump curve should be read not only before purchase, but after installation with the flow rate and pressure readings taken and compared against the original curve to ensure the pump is operating within a safe area on the curve. This ensures your pump lasts as long as possible whilst operating as efficiently as possible. Many of the calculations used for pump performance are based on theoretical values depending on NPSH available, pipework age, and pressure losses. It is therefore essential to check the operation of the pump after install.
Castle Pumps recommend that suction and discharge gauges are mounted on pipework to enable site engineers to check the area of pump operation easily. As a pump produces differential pressure, by measuring the difference between the inlet and outlet pressure we can determine the pressure being produced by the pump which will assist in troubleshooting any issues.